Classic web analytics data is an incredible asset to SEO. Here are
three examples of ways to utilize this data for SEO purposes:Look at your daily referral reports to detect newly received
inbound links (the great majority of webmasters click on a link after
implementing it, to make sure it works)
Look at the search terms people use to come to your site to spot
long tail search opportunities
Measure the results of your campaigns by tracking the increase
in conversions you are driving over time
Web analytics are a must-have for any web publisher.
1. Basic Overview
Your hosting company most likely provides a free web analytics
solution, such as AWStats, Webalizer, or something similar.
Although these tools provide valuable data, they are very limited in
scope, and other tools out there provide significantly more data. Here
are six of the best-known ones:
Web analytics platforms track your site’s traffic in two major
ways. The older of the two methodologies is to use software that
analyzes your web server logfiles after traffic has occurred. Setting up
this type of solution generally involves installing the software on an
internal server that is able to gain access to the logfiles.
The newer methodology involves implementing JavaScript tags on all
of the pages of your website. Provided that you have a basic template
for your pages, this generally is a fairly straightforward process.
JavaScript then tracks the activity on your web pages as it happens and
builds a data profile reflecting that activity.
2. Selecting the Right Analytics Package
Logfile tracking and JavaScript tracking are equally valid
methods, and each has its own strengths and weaknesses. The biggest
advantage of the logfile method is that you can track search engine
crawler activity on your site. This is something you cannot do in
JavaScript implementations, because search engine crawlers do not
execute the JavaScript.
The second big advantage of a logfile-based solution is that you
run the software in-house, so no third party has a copy of a logfile
with your proprietary traffic data on it. This distinction can be a big
security issue for some organizations.
Ultimately, most companies opt for JavaScript tracking because
JavaScript offers a much greater level of flexibility than logfiles. You
can tweak the JavaScript to do custom conversion tracking, or gather
pages into logical groupings in a manner that cannot be done in
logfile-based applications.
Some companies, such as Unica and Webtrends, will offer you both
options, or they will even offer the option to implement a combined
solution. This kind of approach can bring you the flexibility and power
of JavaScript, but still get you your search engine robot crawling data
as well.
Making this decision is only the first step in picking an
analytics package. We listed six of the more popular vendors earlier,
and there are many more vendors than that. Each of these packages has
different strengths and weaknesses. Not only that, they all do their
counting a little bit differently. The chart from Stone Temple Consulting’s Web
Analytics Shootout report, shown in Figure 1, helps to illustrate the
point.
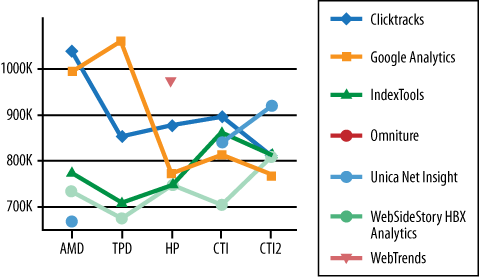
The chart in Figure 9-1 shows the
results of seven different analytics packages (listed on the right). The
traffic data for each vendor is reported across five different sites
(represented by the acronyms on the bottom).
On the AMD site, the lowest reporting package (HBX Analytics)
shows a little less than 750,000 unique visitors, and the highest
reporting package (Clicktracks) shows about 1,050,000 unique visitors
during the same period—almost 50% more!
These differences result from different decisions in how the
analytics packages conduct visitor tracking. None of them are right or
wrong, they are just different in the exact thing they are
measuring.
Note:
HBX Analytics, which is listed in Figure 1, is no longer available, as
WebSideStory was acquired by Omniture. In addition, IndexTools was
acquired by Yahoo! and is now called Yahoo! Web Analytics.
The more important component of this is whether the functionality
of the web analytics software fits your needs. Making this more
difficult to understand is the fact that you often do not know what your
requirements are until you have used analytics for a while. As you
engage with analytics, you will continually learn more things you want
to investigate, and develop new requirements.
For many companies, one of the best solutions is to start with a
free analytics package such as Google Analytics or Yahoo! Web Analytics
and then look to buy a higher-end solution once they have pushed these
packages to their limits. By pushing the limits of these free analytics
products first, you will end up developing a set of requirements you can
use in deciding where to go next.
None of this is meant to say that you should not brainstorm your
requirements in detail before selecting an analytics package. You should
(and must). Just expect that you will develop new requirements along the
way. Web analytics is a journey that unfolds over time.
Based on the requirements you establish in your upfront
brainstorming, you may find that you require a set of features that the
free packages do not provide. Use that as knowledge to select the right
package to start with.
3. Valuable SEO Data in Web Analytics
You can extract all kinds of data from web analytics. Here are a
few of the more interesting types of information you may want to
extract.
3.1. Traffic by search engine
One of the first things you may want to know is the breakout of
traffic by search engine. Figure 2 provides an example of
such a report in Google Analytics.
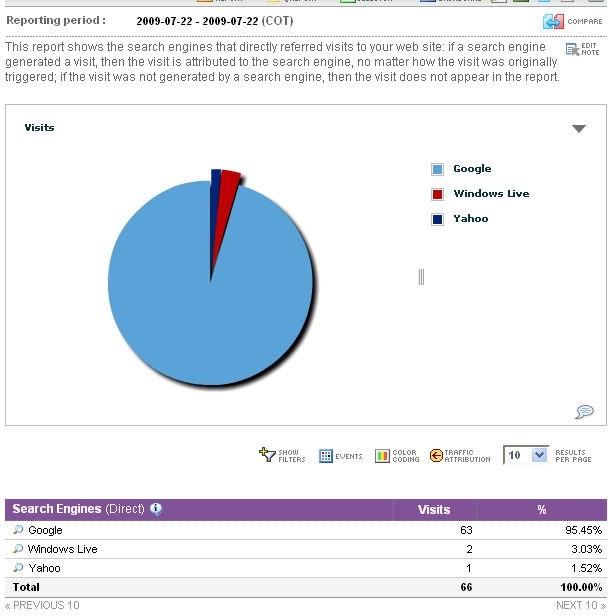
Notice how small the traffic is on Yahoo! compared to Google
(about 2.5%). This may be indicative of a problem with the site in
question and Yahoo!. This site owner might want to spend some time
exploring why the site traffic from Yahoo! is so low.
3.2. Traffic by keyword
One of the basic data points of interest for an SEO practitioner
is what search terms are bringing traffic to the website. This
provides a quick way to see where the SEO campaign is going well and
where it is not going so well. You can also use this to spot
opportunities where a key search term is providing some traffic, but
not as much as you would expect if you were ranking highly for that
term.
You can then look to see where you are ranking for that term.
Perhaps you are in a lower position on the first page, or on the
second page of the SERPs. If so, it might make sense to focus some
attention on this term. With a little effort, such as a focused
link-building campaign for the page in question, you may be able to
move up several positions and obtain a traffic boost.
A traffic-by-keyword report can also show you the long tail of
search as it relates to your current site. Figure 3 depicts a snippet from the organic
search phrases report of Yahoo! Web Analytics showing some of the
small-volume terms for Stone
Temple Consulting’s website.
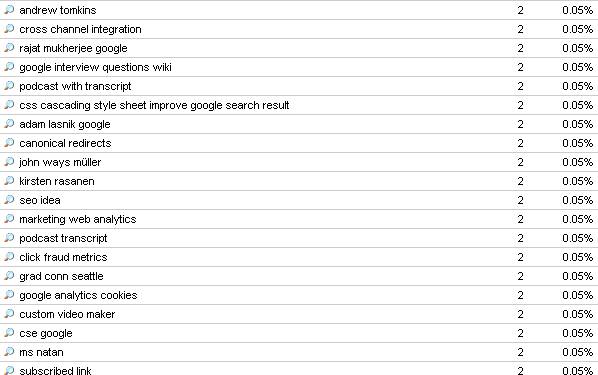
Notice that a lot of names are showing up in the list, in
addition to the rather interesting who is the author
of
ask.com. Looking into this query data can
give you a broad perspective on opportunities for long tail
search.
Notice also how two of the names combine
Google with a person’s name (jack
ancone google and google carter). This
could indicate an opportunity to make sure the person’s organization
name is a part of the title of the articles in the Stone Temple
Consulting interview series.
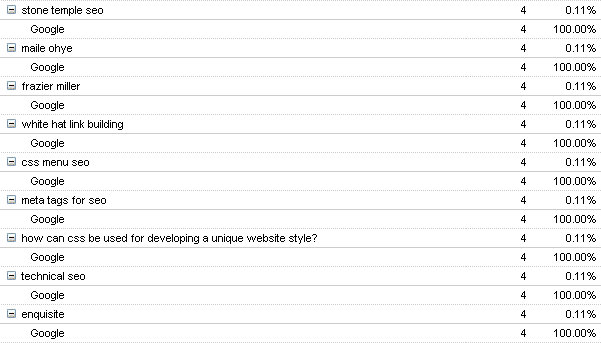
4. Segmenting Search Traffic with Multiple Parameters
Next, you can consider putting these things together. Even the
free tools provide substantial capability for building out custom
reports. Figure 4
depicts a screen shot from Yahoo! Web Analytics that shows the search
phrases just for Google, and the pages of the site that Google sent
users to when users clicked on your link.
This is a key improvement to your SEO research for two
reasons:
If you are looking into what terms can bring fast traffic
benefits as a result of some additional optimization, you are going
to want to know in which search engine you are ranking.
If you are going to optimize a page to rank higher, you will
need to make sure you are optimizing the right page!
5. Referring Sites
It is interesting to look at a referring site report for a number
of reasons, but one of the more interesting SEO reasons to do so is to
spot when you receive new links. You can often see those new links in
these reports first, even before the search engines report them. Figure 5 shows a sample portion of the
referring sites report from Google Analytics.
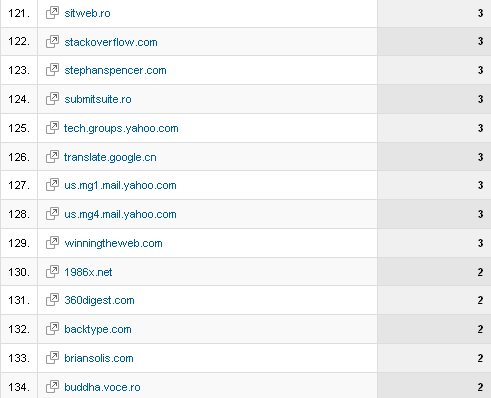
Expanding on this example, consider the site circled in Figure 5, edwardbeckett.com. If this is the
first time you have ever noticed this site in your referrers, it can be
a leading indicator that you have received a new link. This is of
interest as it can help you to detect new links that result from your
link-building campaigns, and therefore help you measure which of your
link-building campaigns are yielding the best results.